Cycle Analysis
See the complete market cycle
Track prices vs the long-term trend. Know if you're buying at the peak or finding value in a trough.
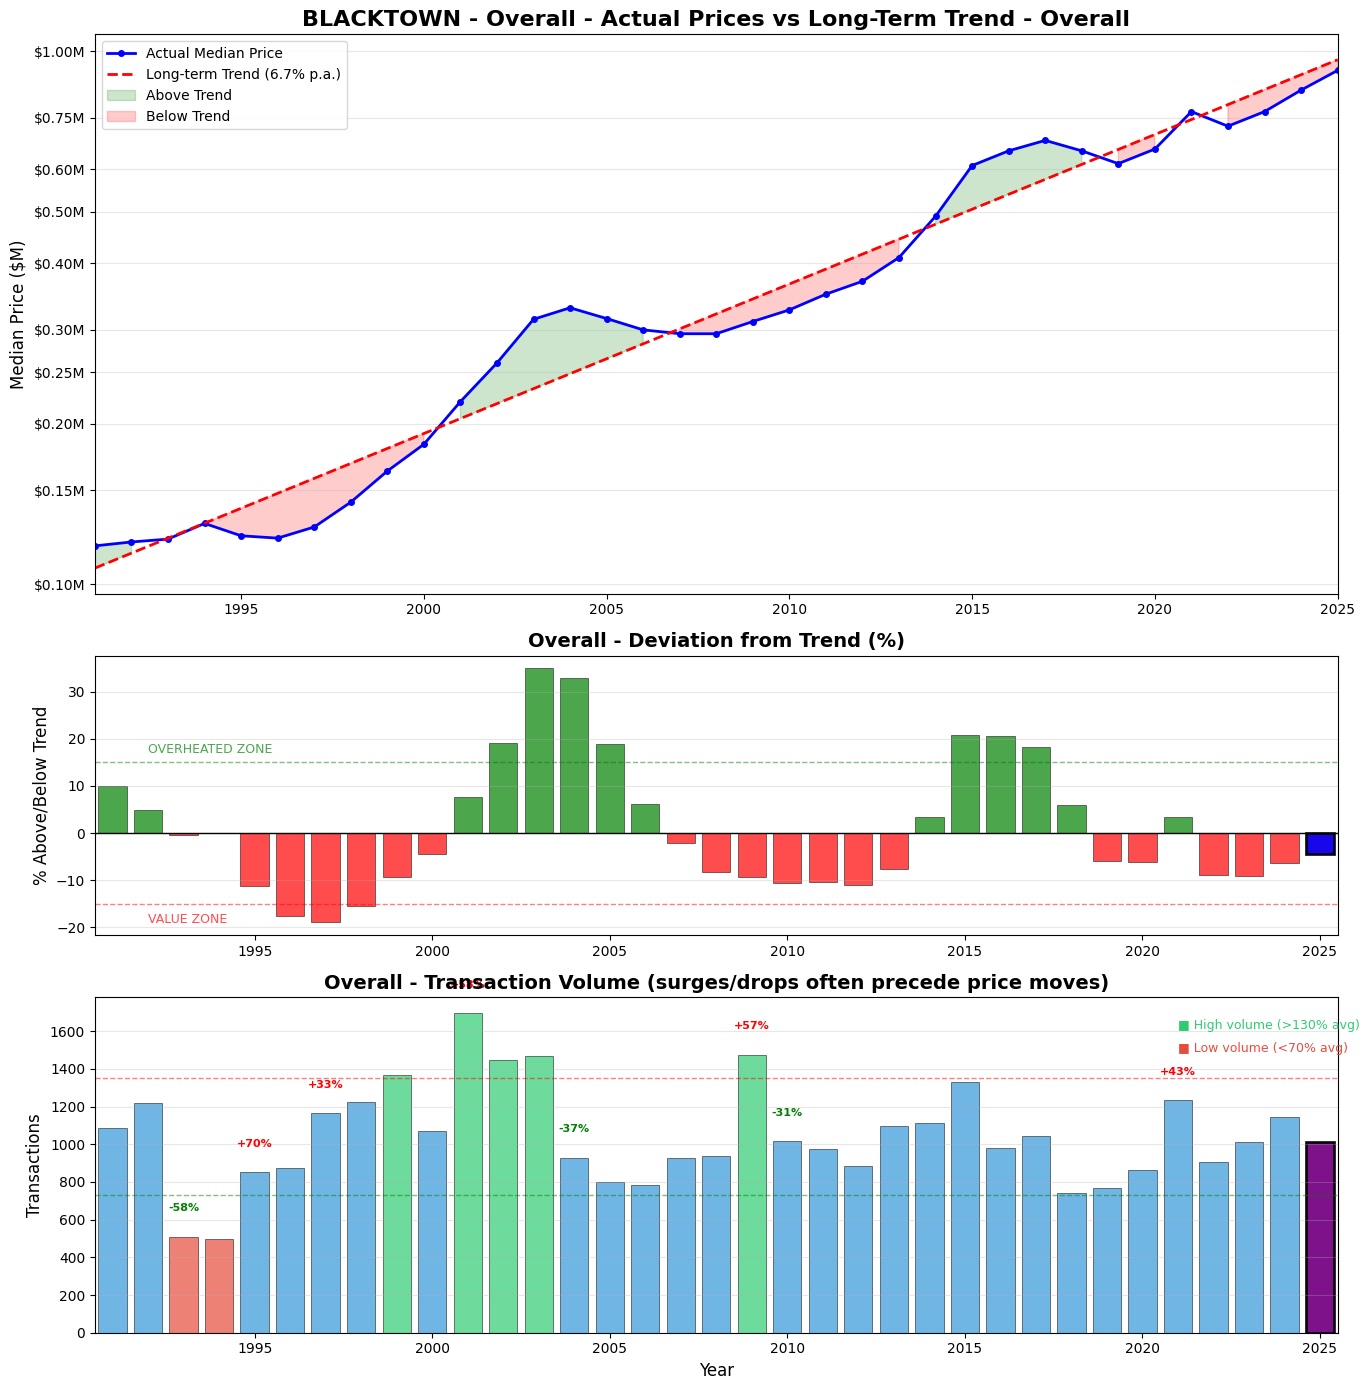
Example: Blacktown - Overall Market Cycle (1990-2025)
Suburb research, done properly.
Explore Free Example →Track prices vs the long-term trend. Know if you're buying at the peak or finding value in a trough.
Example: Blacktown - Overall Market Cycle (1990-2025)
Don't mix apples and oranges. See distinct trends for freestanding houses vs strata properties.
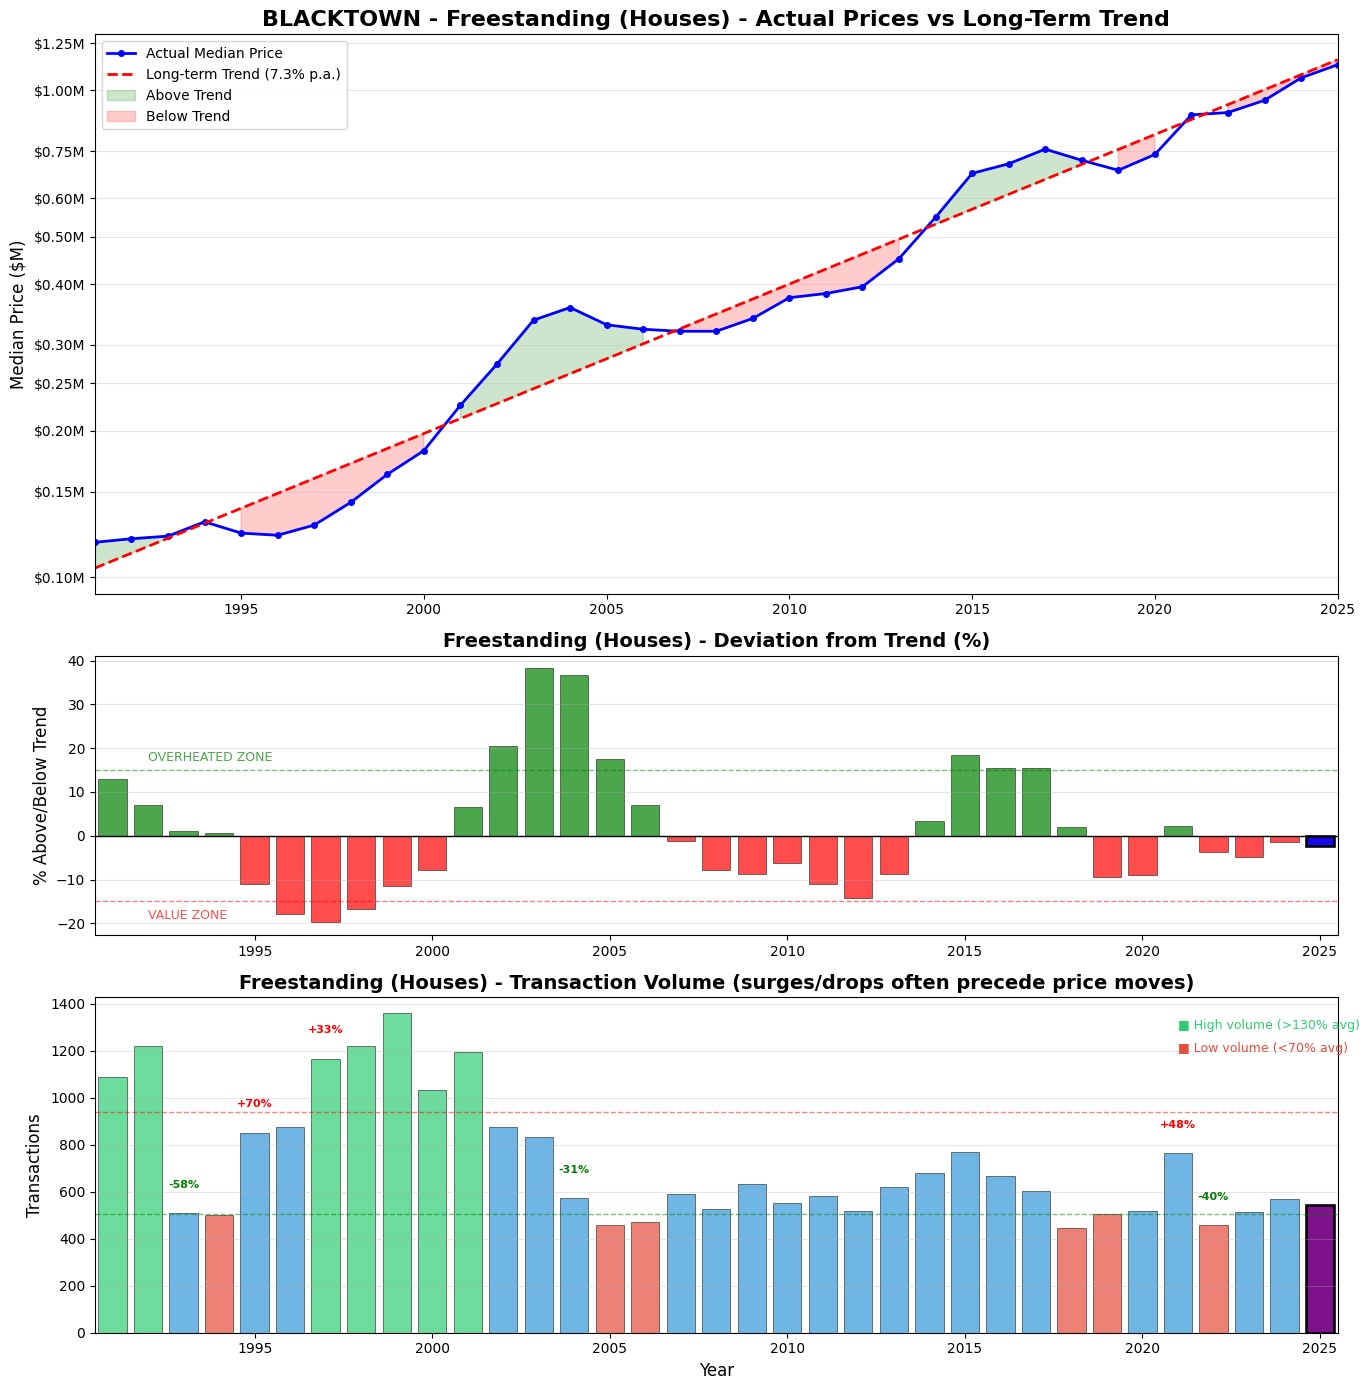
Example: Blacktown - Freestanding Houses Only
Price per square metre by street. Identify hidden value or avoid overpaying on trophy streets.
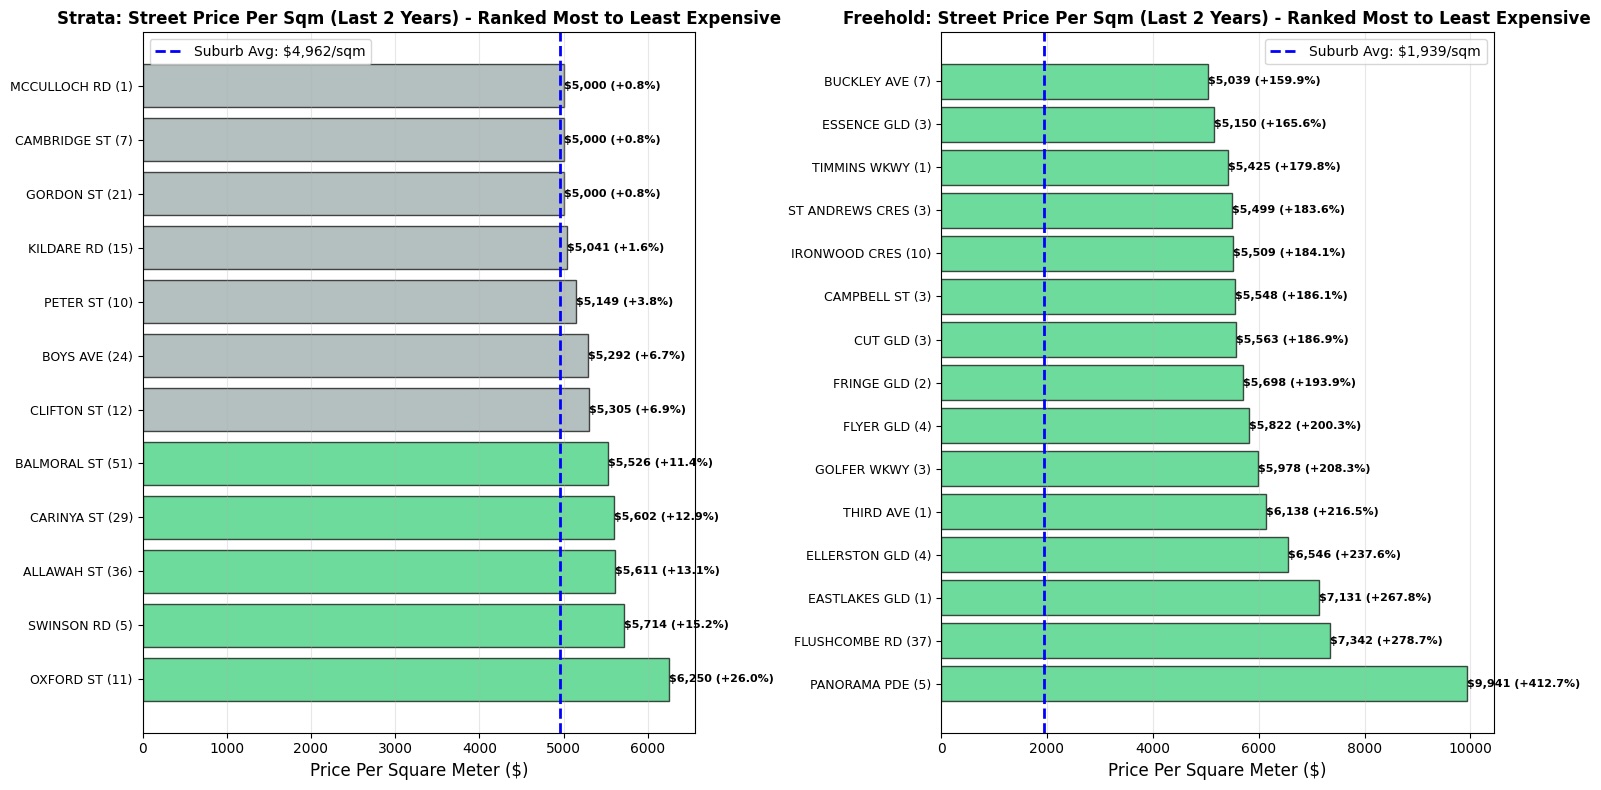
Example: Blacktown - Price per m² by Street (Last 2 Years)
See which streets are appreciating fastest year over year. Identify emerging hot spots before they peak.
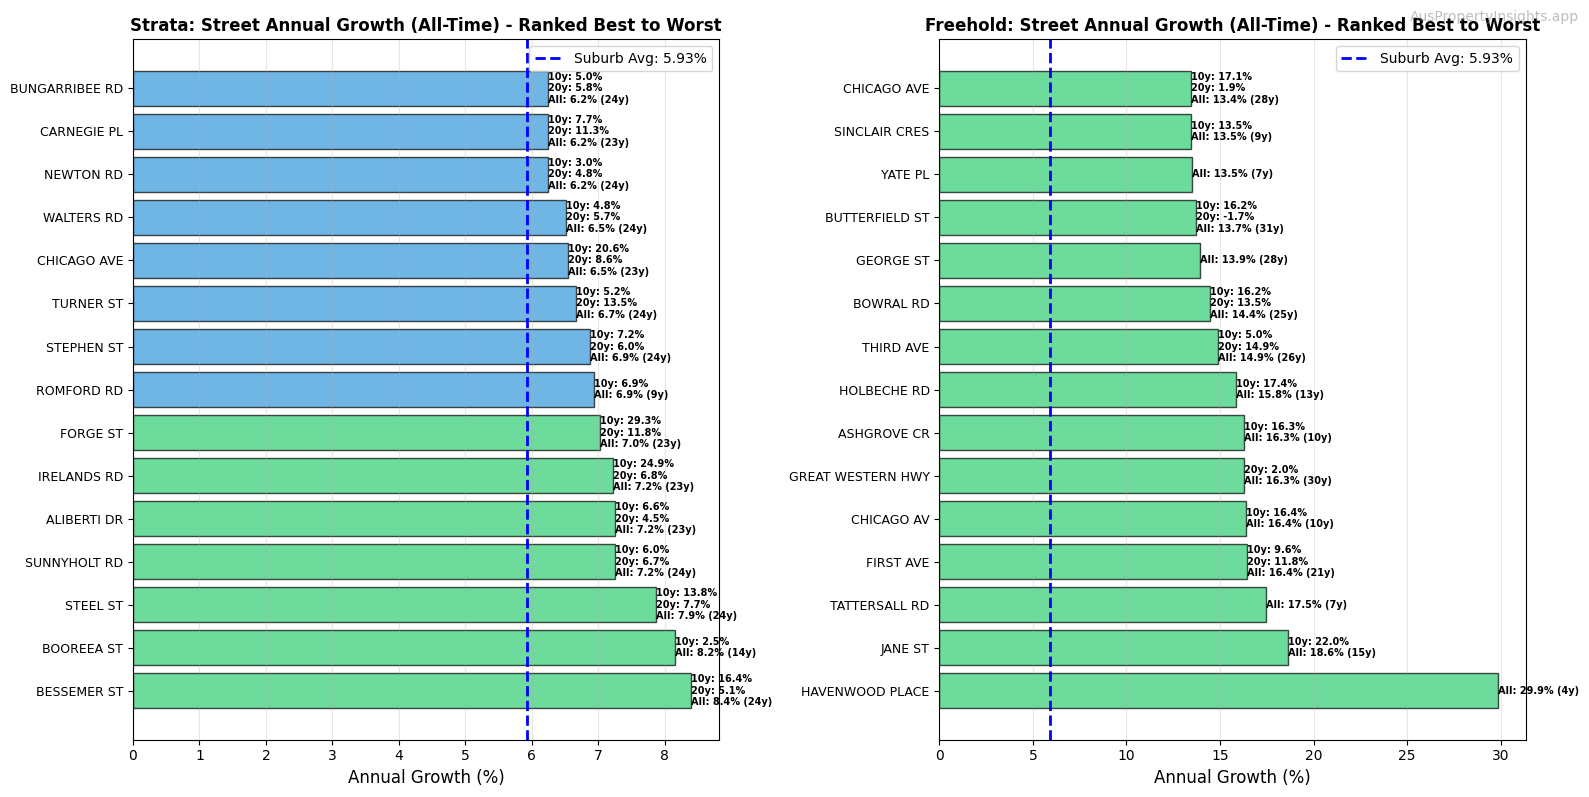
Example: Blacktown - Annual Growth Rate by Street
See how individual buildings perform against each other. Find undervalued strata units in premium buildings.
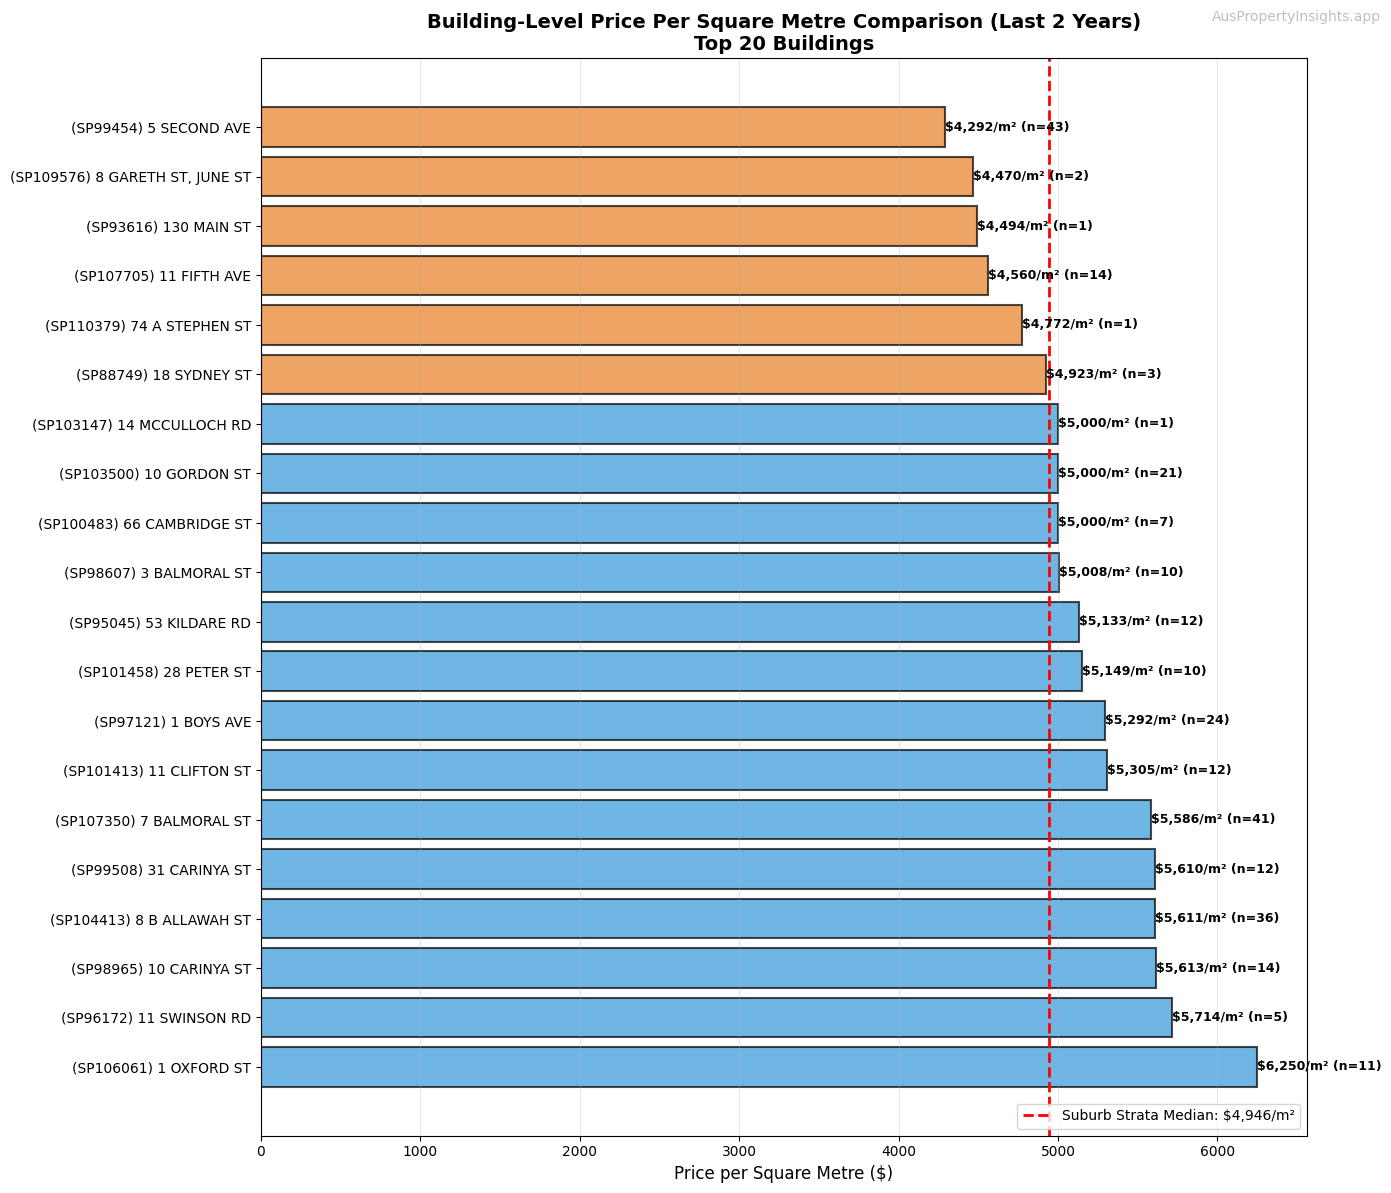
Example: Blacktown - Building-Level Price Analysis
Extended settlement periods often signal issues. See which streets have a history of delayed settlements.
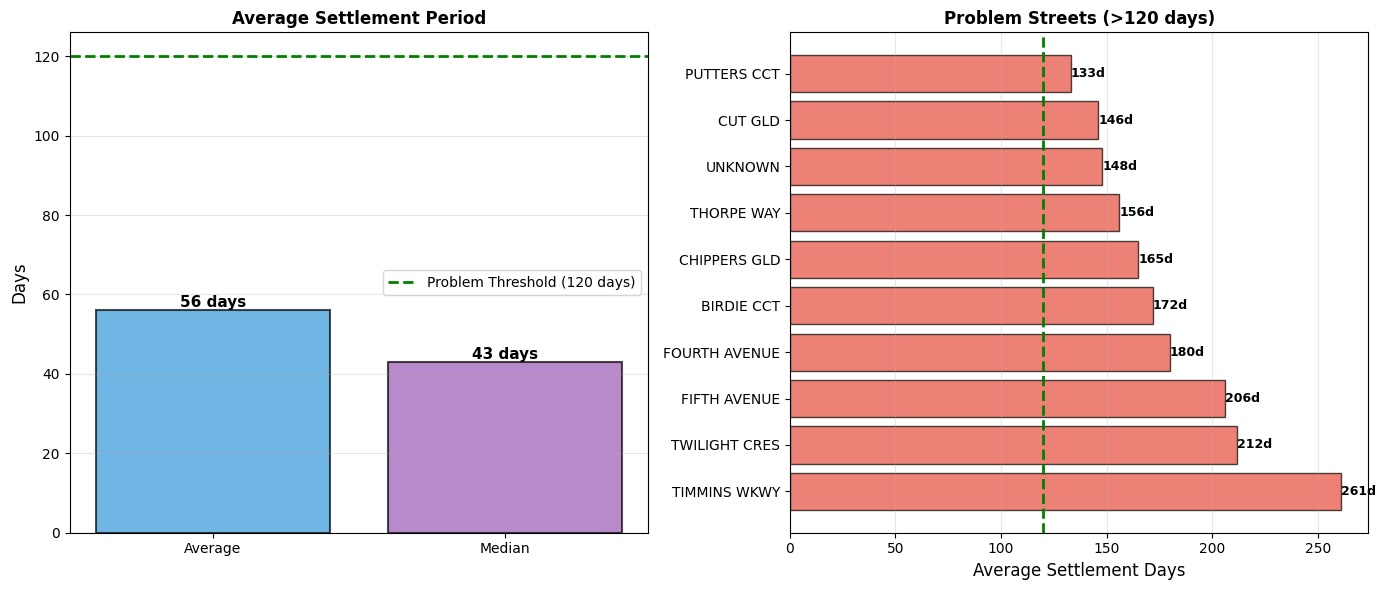
Example: Blacktown - Streets with Settlement Delays (>120 days)
Track densification over time. See which streets are converting from houses to apartments.
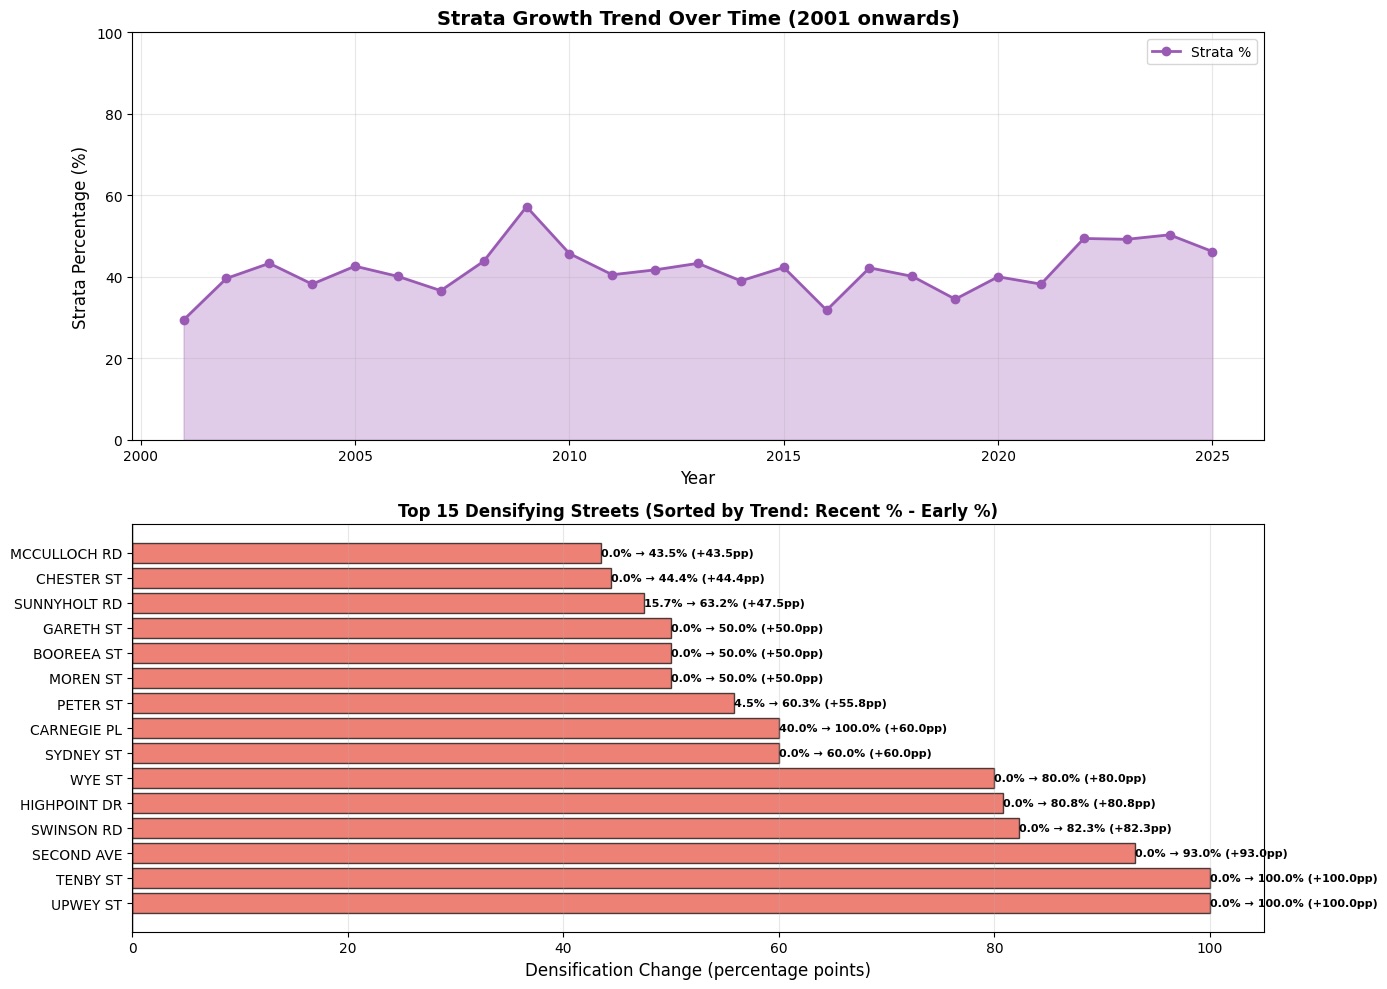
Example: Blacktown - Strata Growth Trend & Densifying Streets
How long do people hold before selling? Short holds may indicate flippers or problems.
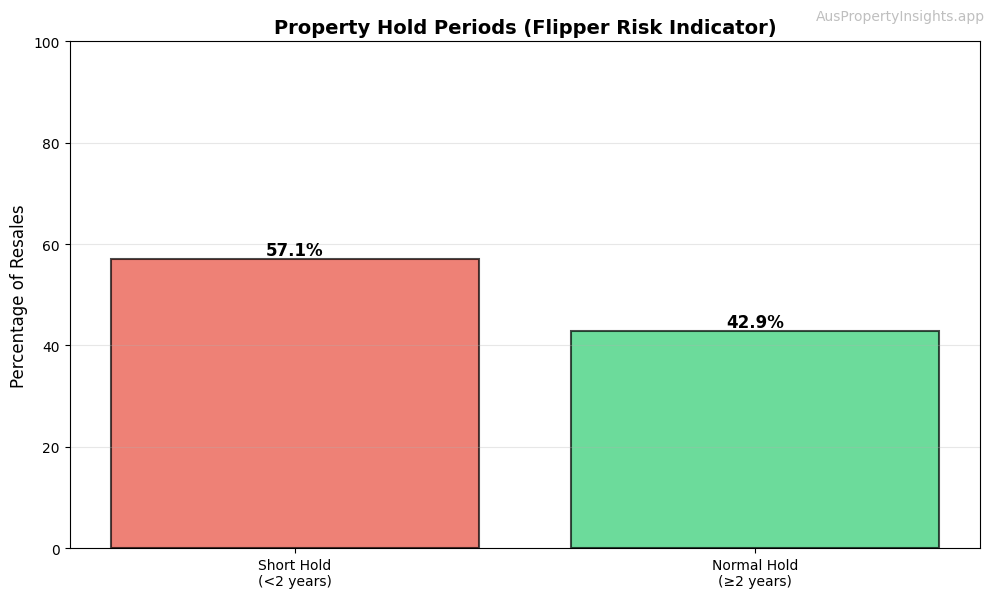
Example: Blacktown - Property Hold Period Analysis
Deep analysis tools to make smarter property decisions
Features we're working on
Access 35 years of NSW property data. Make informed decisions.