35 years of NSW
property data.
Suburb research, done properly.
Explore NSW Suburbs
Free property cycle data for every suburb
RBA Rate Impact Calculator
See how RBA rate changes historically impact property prices in your suburb. Based on regression analysis of 7.3 million NSW property sales.
See the complete market cycle
Track prices vs the long-term trend. Know if you're buying at the peak or finding value in a trough.
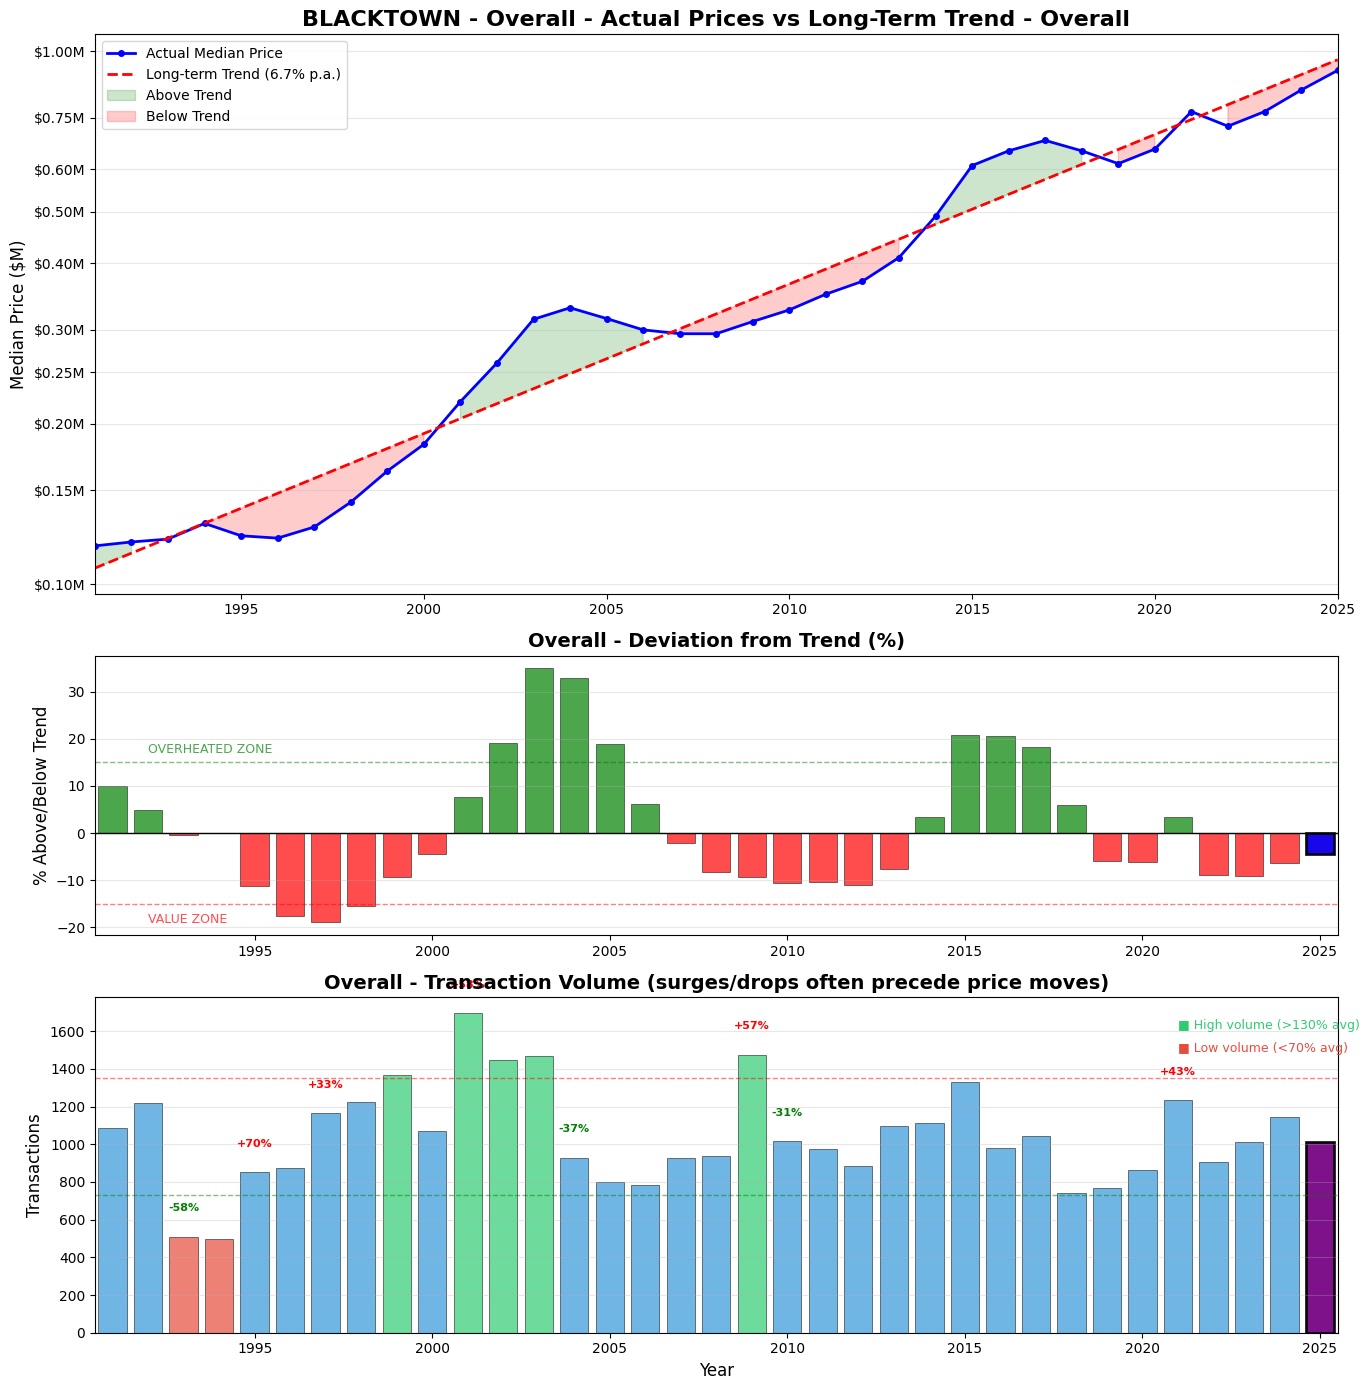
Example: Blacktown - Overall Market Cycle (1990-2025)
Houses vs apartments, separated
Don't mix apples and oranges. See distinct trends for freestanding houses vs strata properties.
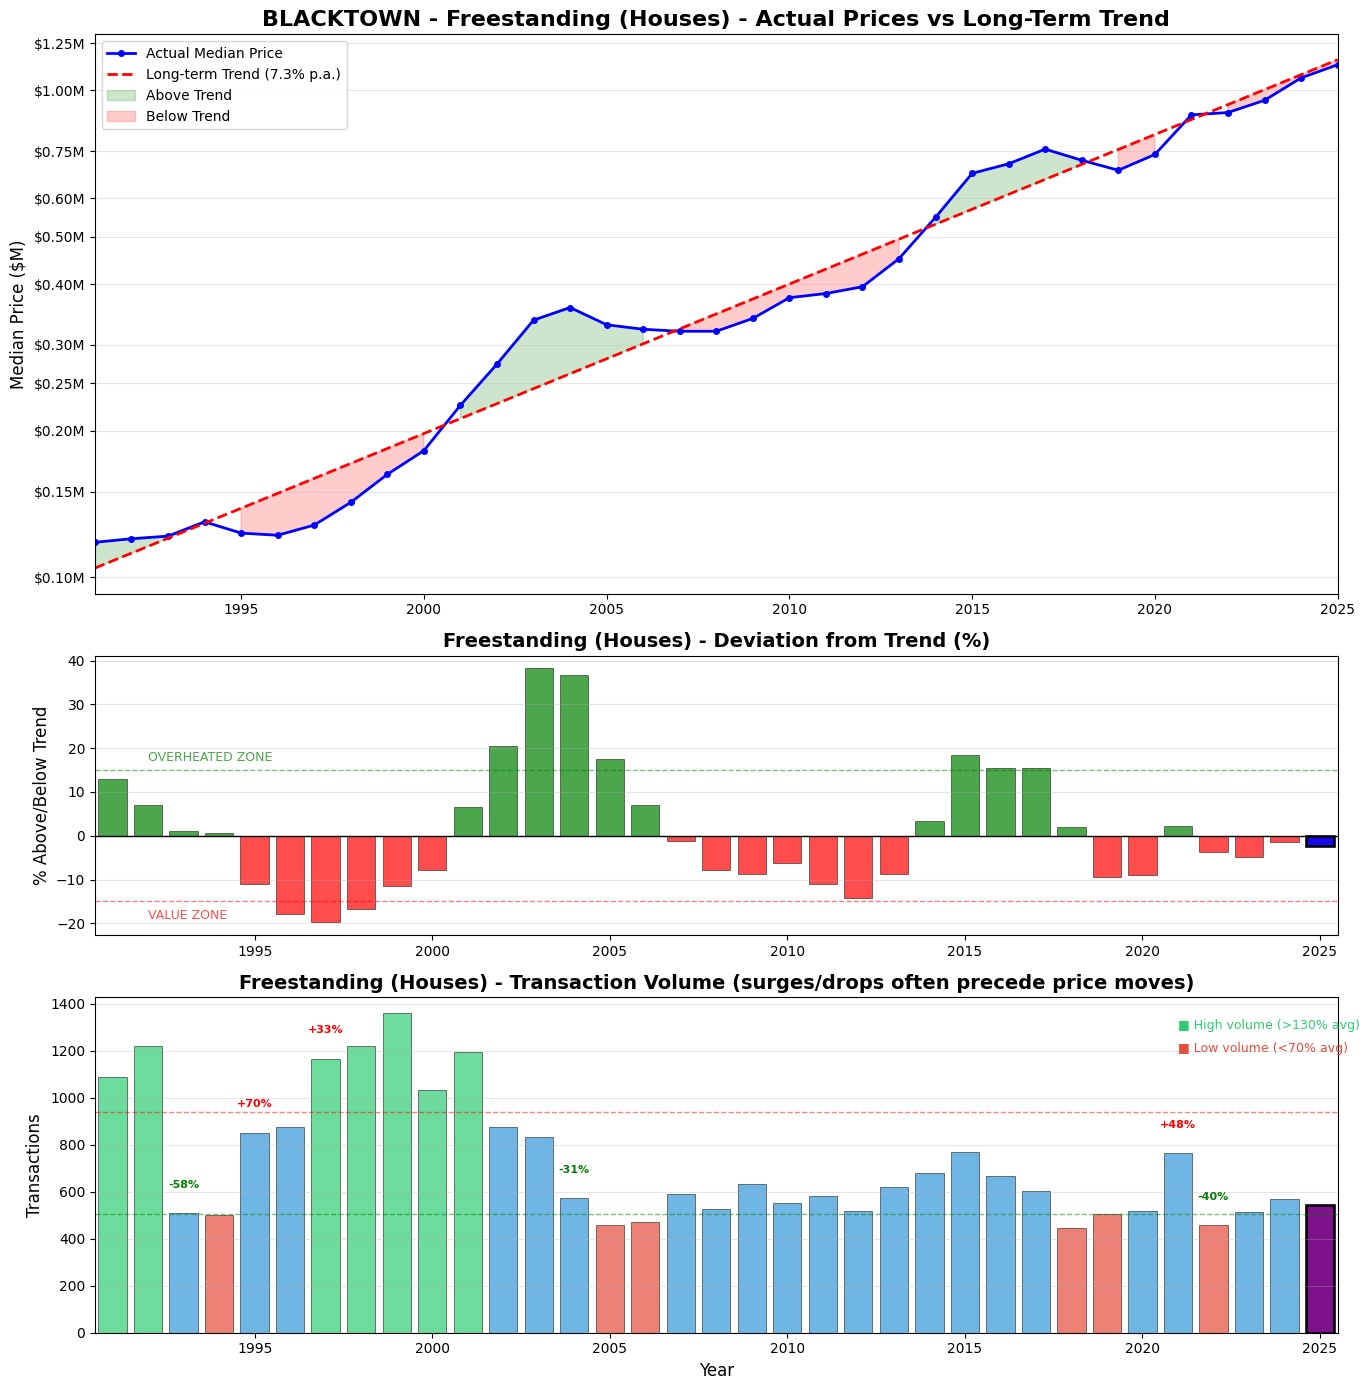
Example: Blacktown - Freestanding Houses Only
Find the premium and discount streets
Price per square metre by street. Identify hidden value or avoid overpaying on trophy streets.
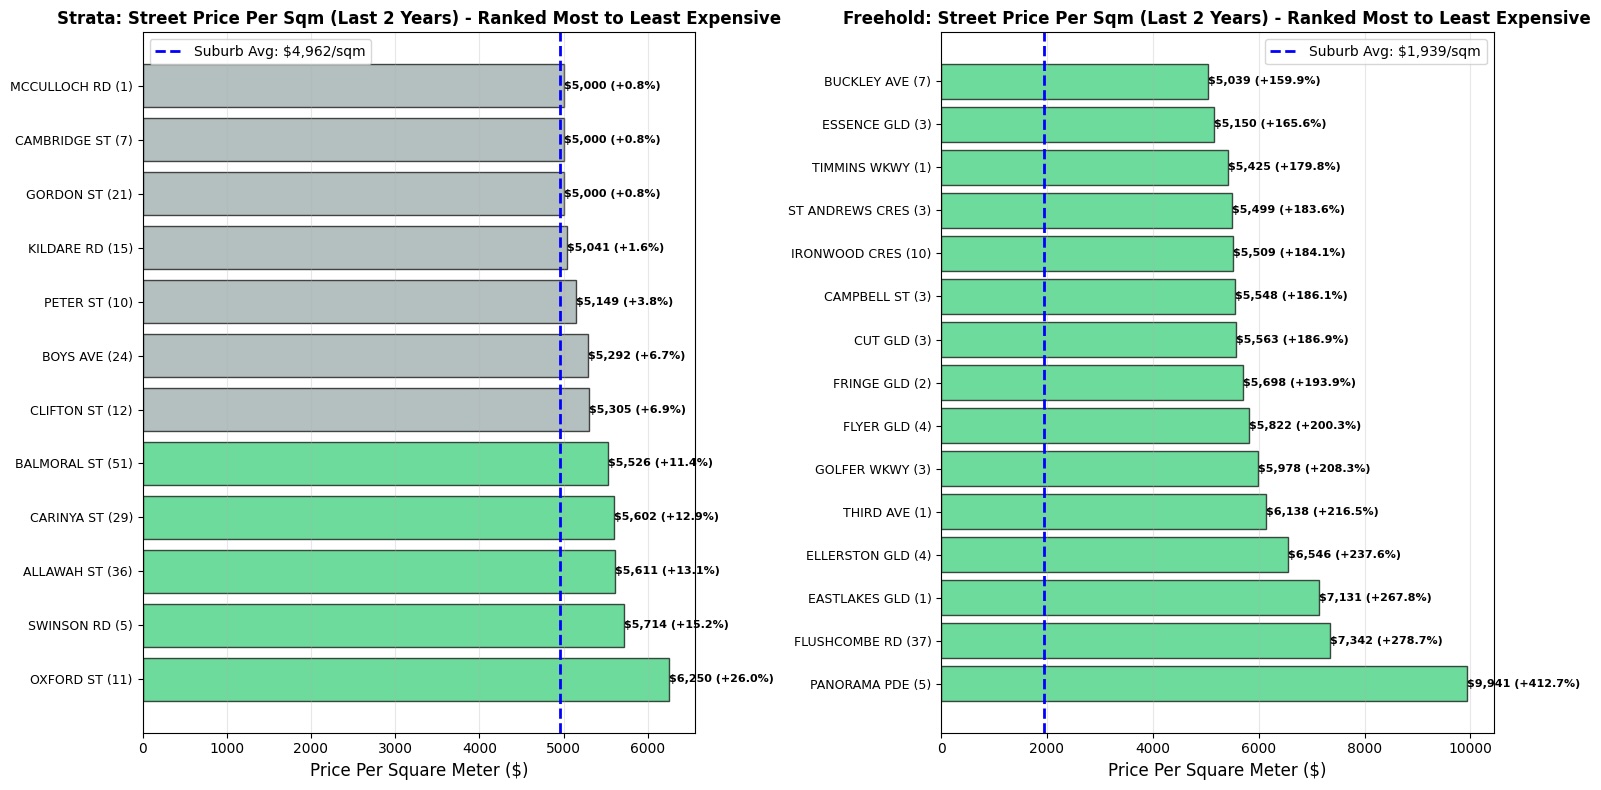
Example: Blacktown - Price per m² by Street (Last 2 Years)
Track street-level annual growth
See which streets are appreciating fastest year over year. Identify emerging hot spots before they peak.
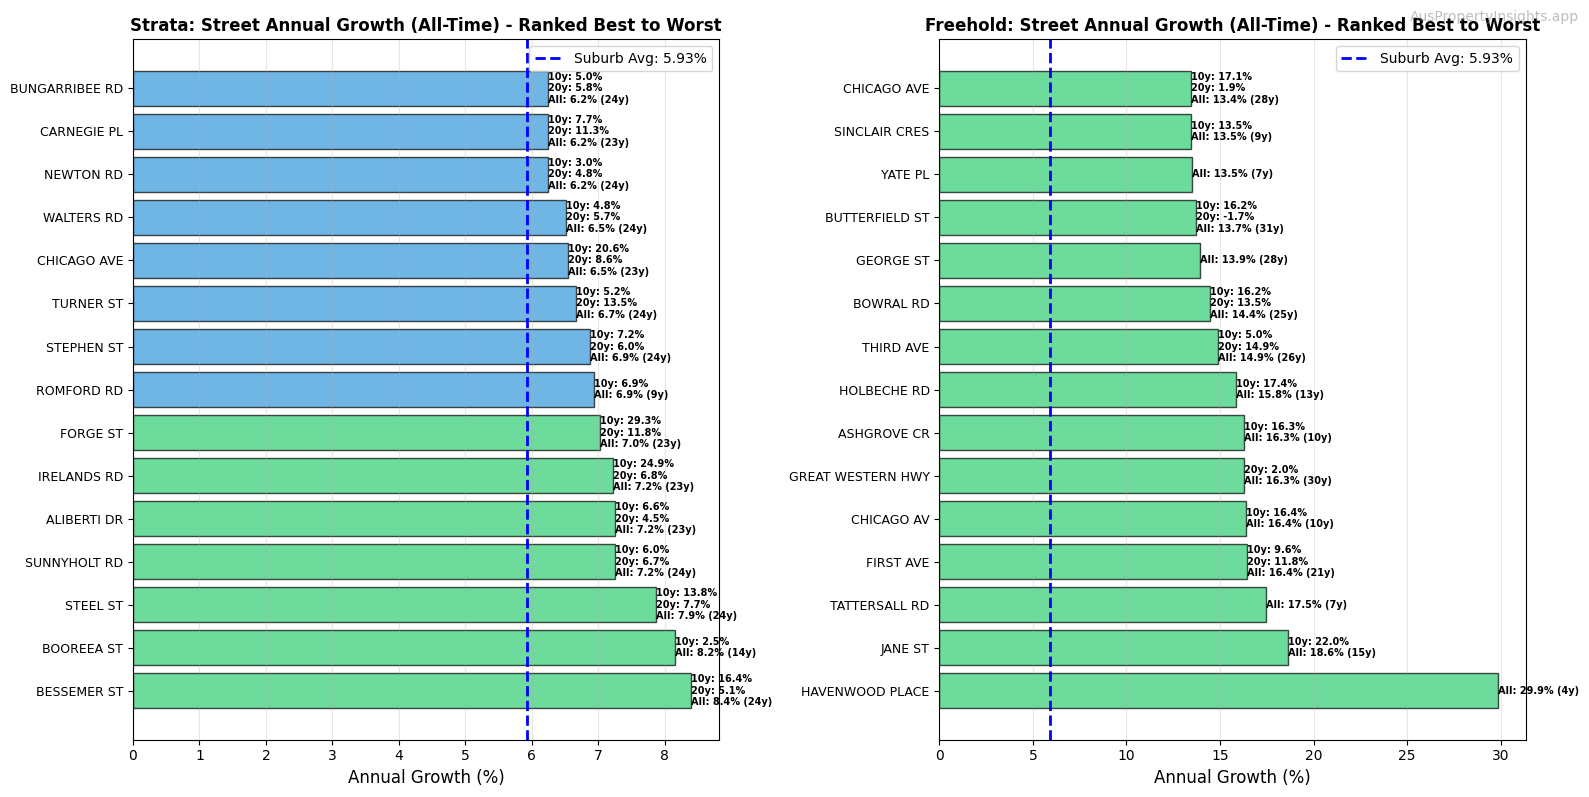
Example: Blacktown - Annual Growth Rate by Street
Compare building price performance
See how individual buildings perform against each other. Find undervalued strata units in premium buildings.
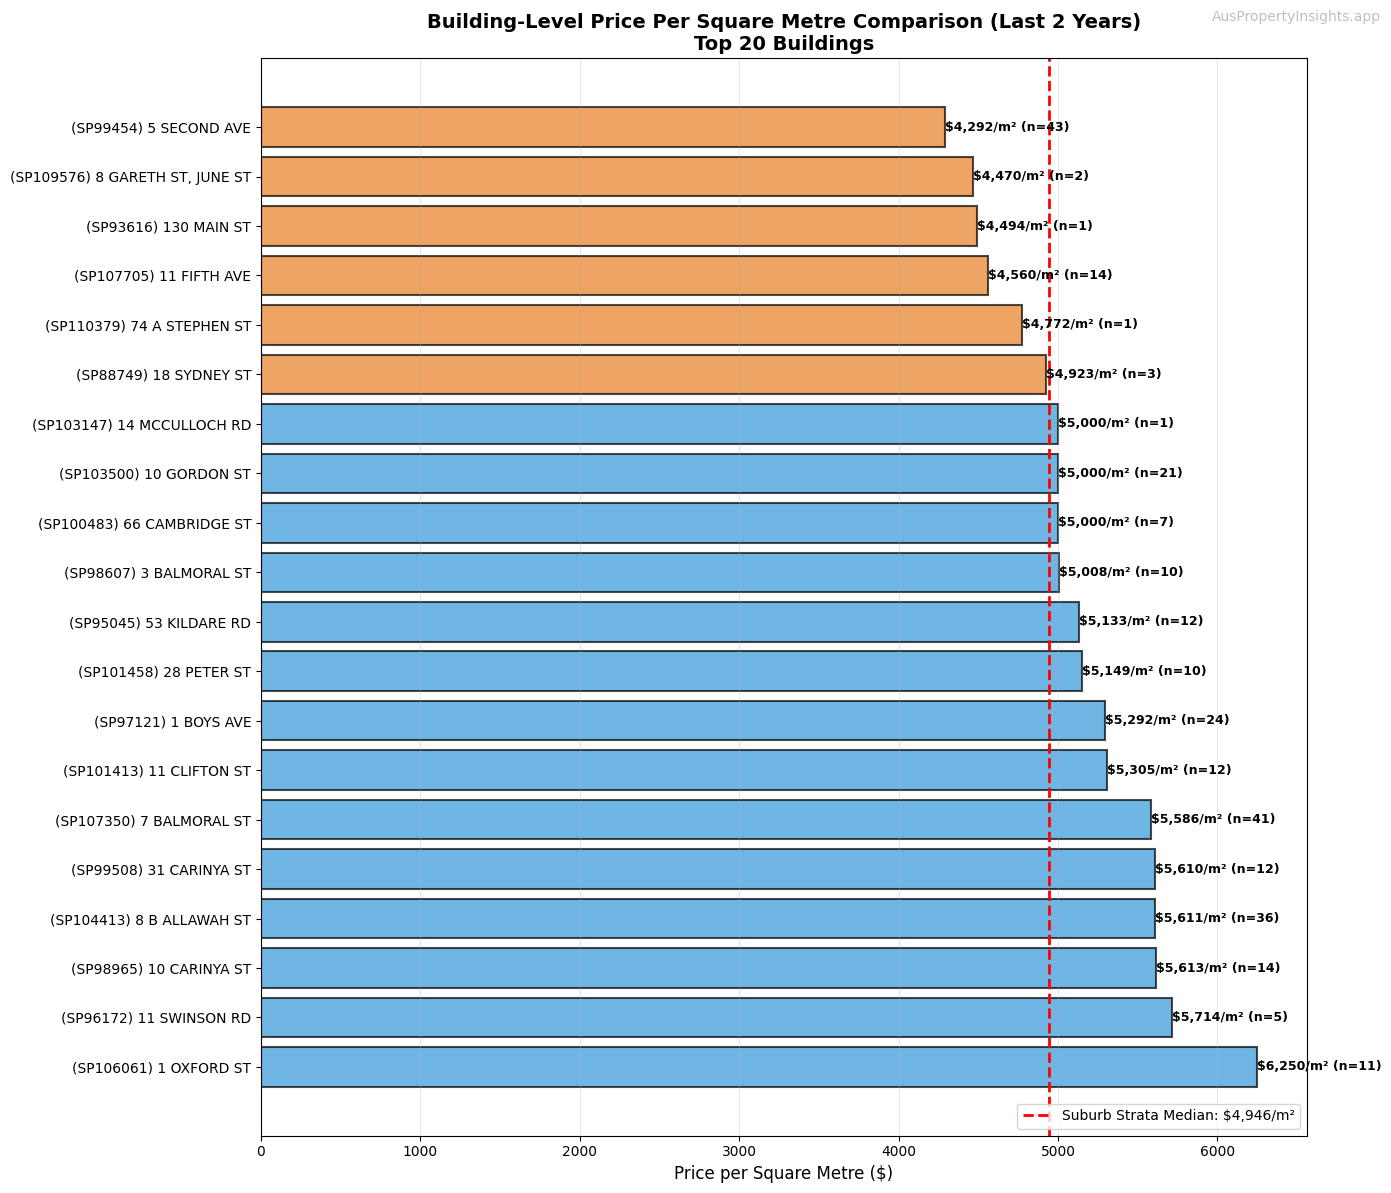
Example: Blacktown - Building-Level Price Analysis
Spot the problem streets
Extended settlement periods often signal issues. See which streets have a history of delayed settlements.
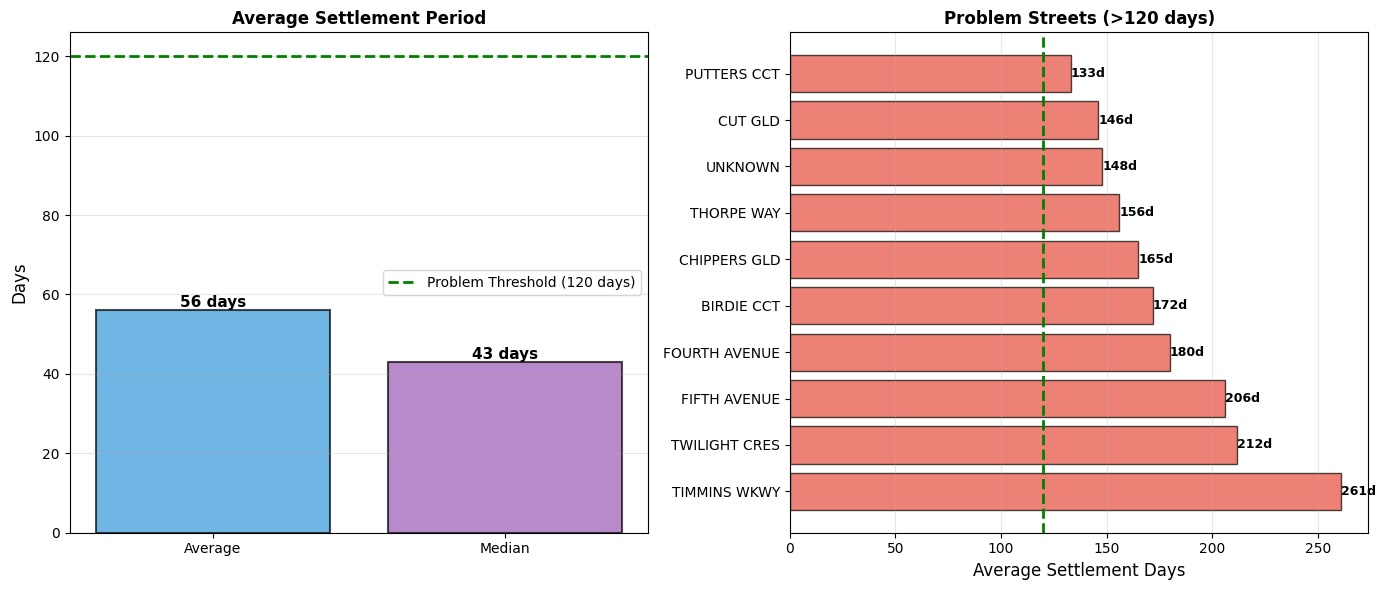
Example: Blacktown - Streets with Settlement Delays (>120 days)
Watch the suburb transform
Track densification over time. See which streets are converting from houses to apartments.
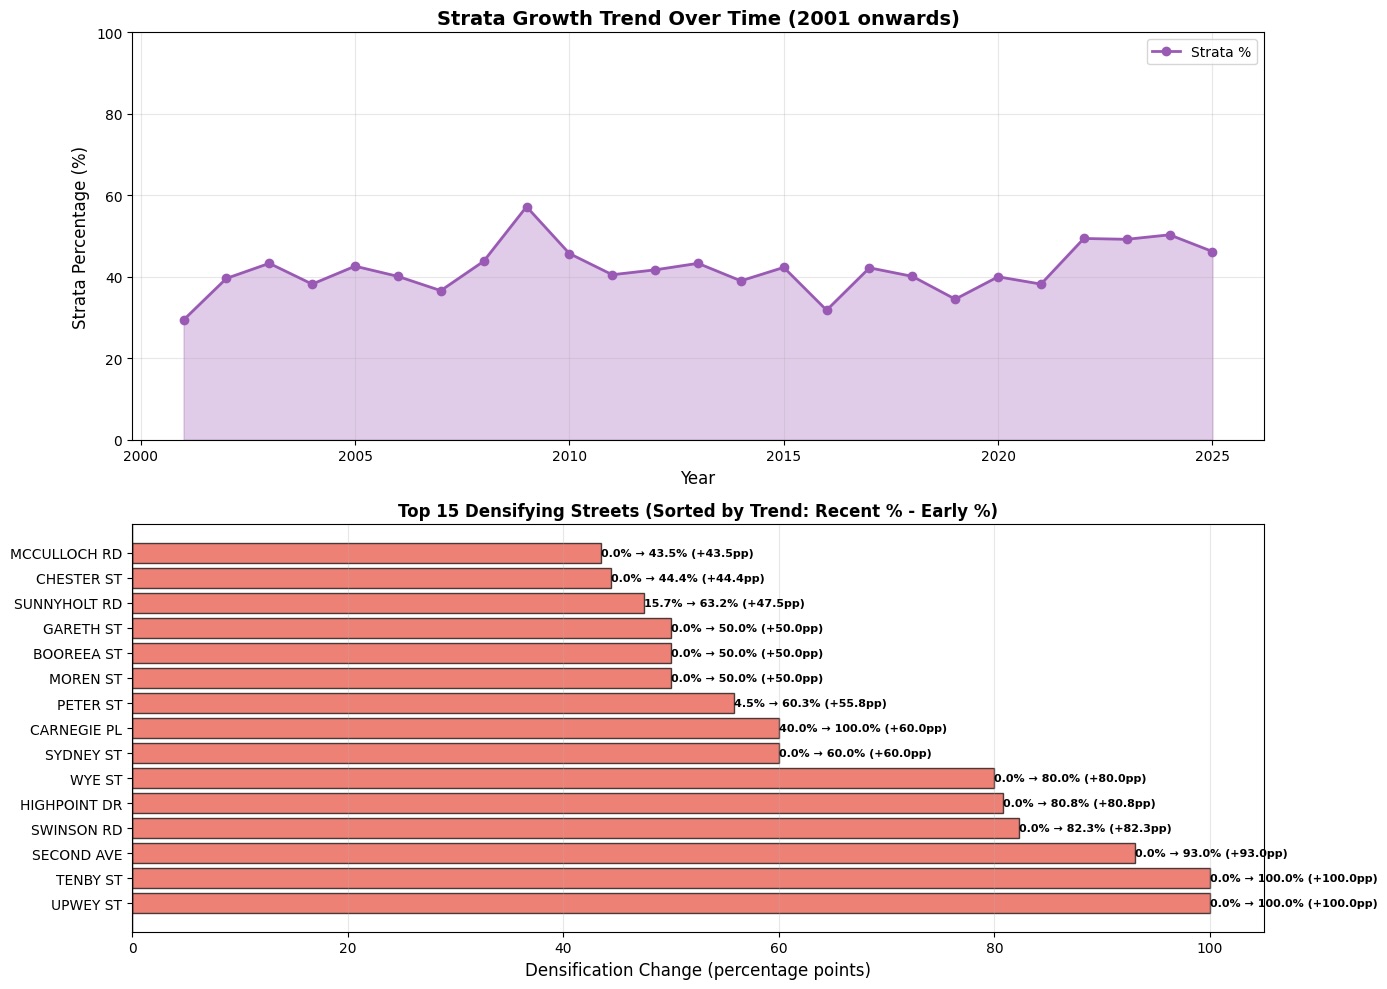
Example: Blacktown - Strata Growth Trend & Densifying Streets
Understand vendor motivation
How long do people hold before selling? Short holds may indicate flippers or problems.
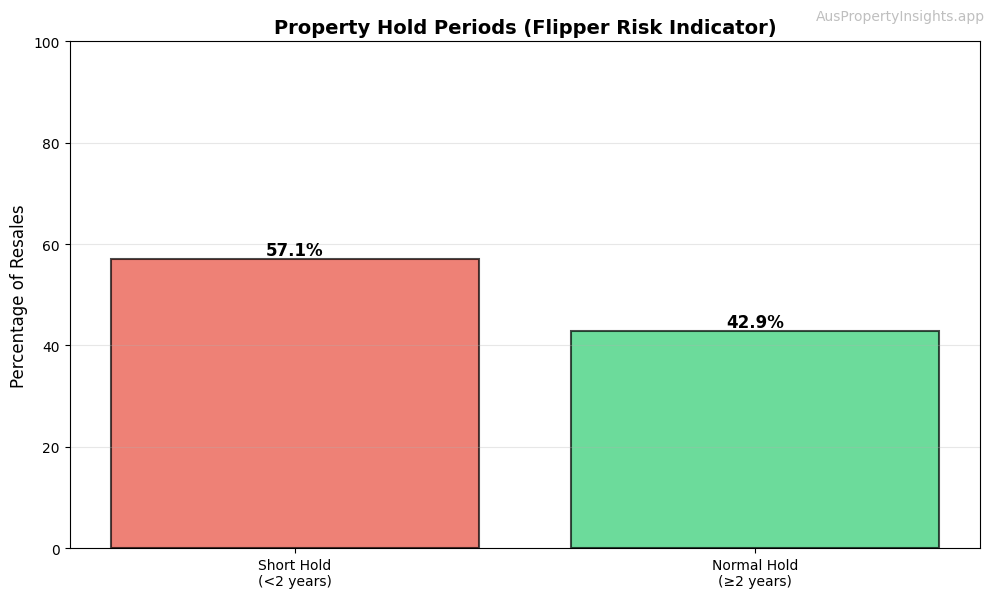
Example: Blacktown - Property Hold Period Analysis
...and many more insights
Deep analysis tools to make smarter property decisions
On the roadmap
Features we're working on
Ready to get street smart?
Access 35 years of NSW property data. Make informed decisions.